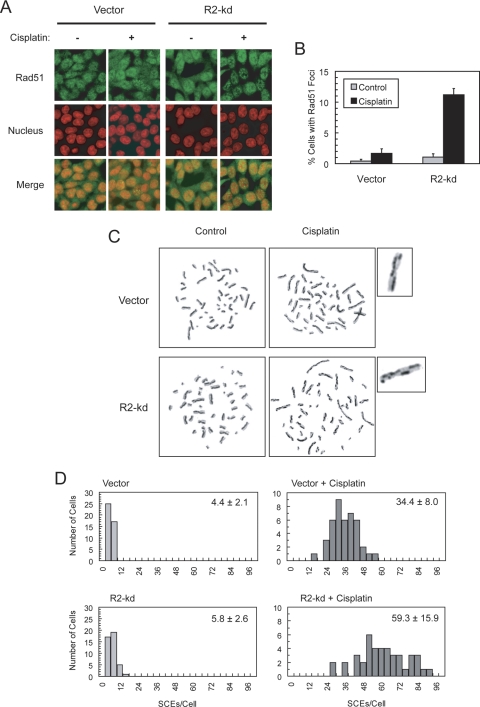
Fig. 5.
A and B, R2-knockdown p53(−/−) HCT-116 cells exhibited an elevated level of cisplatin-induced Rad51 foci formation. Cells were pulsed with 10 μM cisplatin for 1 h and incubated with cisplatin-free medium for 6 h before fixation. Slides were subsequently stained and imaged for Rad51 foci (green) and nuclei (red) by confocal microscopy. The percentage of cells with ≥ 10 Rad51 foci for at least 500 cells counted in each treatment group is presented as a bar graph; error bars represent S.E. C and D, R2-knockdown cells exhibited an increase in cisplatin-induced SCE. Cells were pulsed with 10 μM cisplatin for 1 h and then exposed to 10 μM BrdU for two cell cycles of DNA replication. Metaphase spreads were prepared, and at least 40 metaphase cells were scored for the number of SCEs. A representative metaphase exhibiting an approximately average SCE level in each treatment group is shown. One chromosome from each cisplatin-treated cell is enlarged to indicate the sites of SCE. Histograms show the frequency of cells with the numbers of SCE. The mean of SCE ± S.E. per cell is indicated for each histogram.

