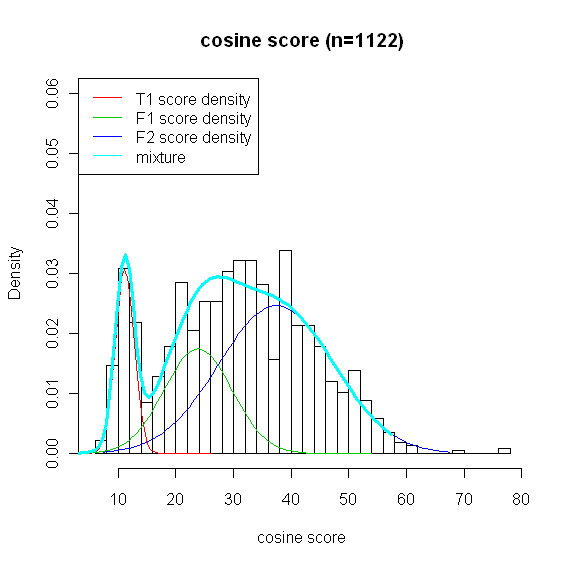
Figure 5.

Histogram of similarity scores and three estimated normal curves. Rat plasma: histogram of 1122 best scores obtained from searching the library and three estimated normal curves (red, green, blue) and mixture distribution (cyon); T1(red) is fT, and F1(green) and F2(blue) are two components of the mixture density fF. The three component normal mixture for similarity score is the mixture of T1, F1, and F2.
