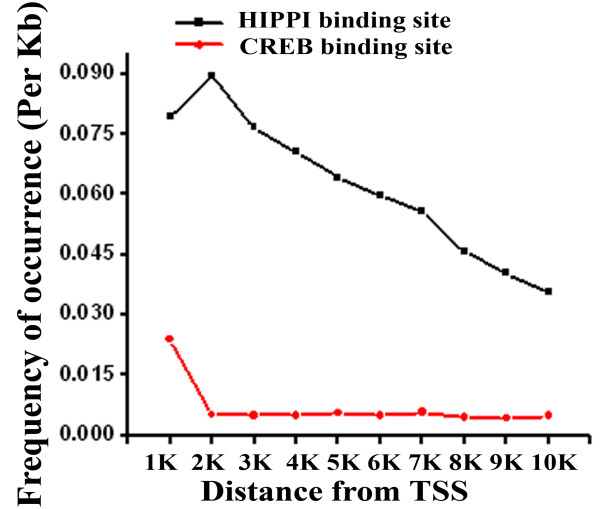
Figure 1.
Distribution of HIPPI binding site (HBS) along the 10 Kb upstream sequences of all the genes in the human genome. Distance was calculated taking the transcription start site (TSS) as '0'. Frequency of occurrence of HBS per kb distance was plotted against the distance from TSS. CREB binding site distribution (Red line) along the same distance was shown to compare the pattern of distribution.

