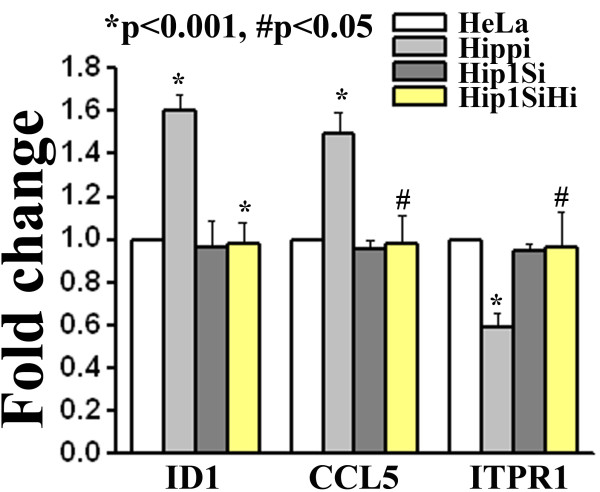
Figure 7.
Relative expression level of some of the genes altered in HD microarray study in presence of HIPPI. Expression of beta actin was taken as control. Error bar represents standard deviation (n = 3). For each gene, expression level in 'Hippi' was compared with expression level in 'HeLa' and that in 'Hip1SiHi' with 'Hippi'. Significance levels of various pairs are indicated in the figure.

