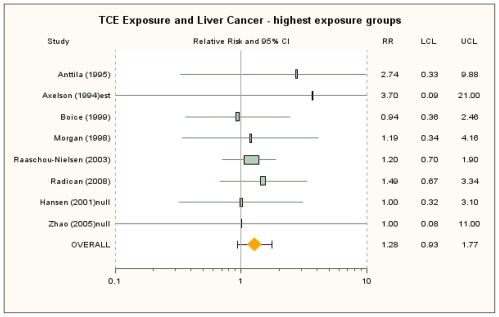
Figure 4.
Forest plot of highest TCE exposure group and liver cancer from random-effects meta-analysis. Individual study results are plotted with 95% confidence intervals. A risk estimate of 1.0 is assigned for highest exposure in Hansen et al. [39] and Zhao et al. [25] to account for presumed reporting bias. Symbol sizes reflect relative weights of the 8 cohort studies.

