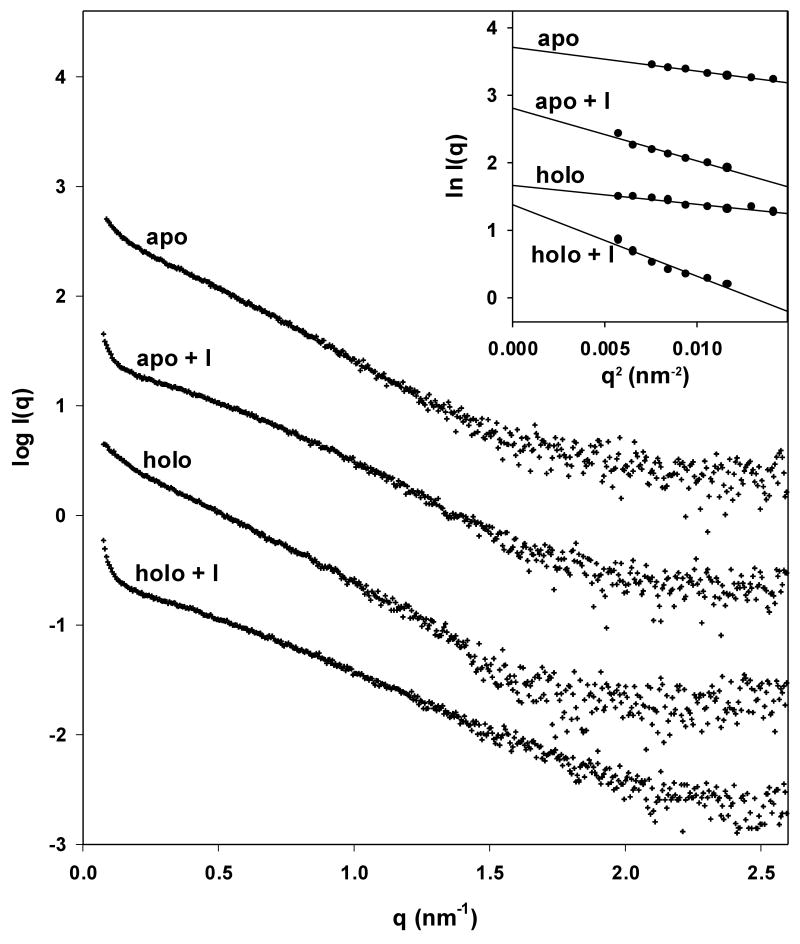
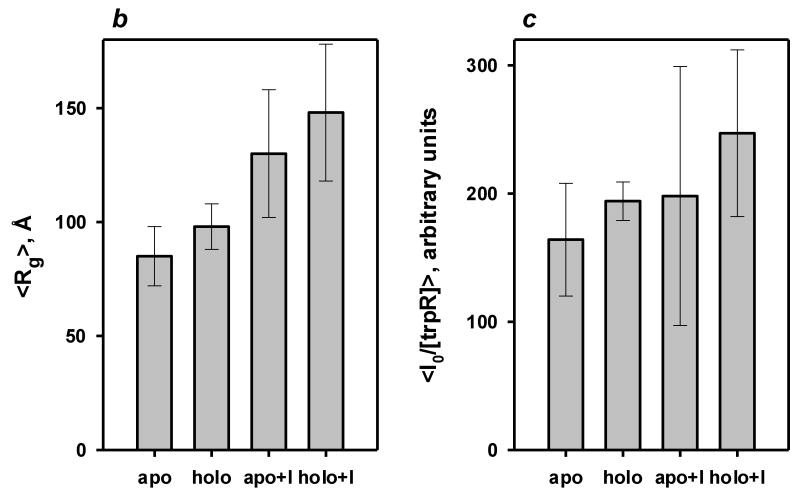
Figure 5.
Small angle X-ray scattering of trpR: intensity vs. resolution profiles. (a) Representative scattering of trpR in solution, ± 2 mM L-tryptophan and ± 16% (v/v) isopropanol. Scattering intensities are plotted as log I(q) vs. q (q=4π sin θ/λ; θ is 1/2 of the scattering angle; λ is the wavelength of the incident radiation). Profiles shown correspond to measurements at 28 mg/ml protein; similar profiles were obtained at 7, 14, and 19 mg/ml. Inset: Guinier plot (ln I(q) vs. q2) of the lowest resolution region, where scattering is dominated by the largest particles in solution. The linear fit was used to estimate the radius of gyration, Rg, and forward scatter, I(0), from the slope and intercept, respectively (see Methods). Y-axis values are offset in both plots for ease of comparison. (b) Distribution of Guinier-derived Rg. (c) Distribution of Guinier-derived forward scatter normalized to protein concentration. In both (b) and (c), vertical bars and brackets indicate the average and standard deviation of four measurements (one each at 7, 14, 19, and 28 mg/ml trpR) for each solution condition. Key: “apo” = trp aporepressor; “holo” = trp aporepressor + 2 mM L-tryptophan; the “+I” extension indicates inclusion of 16% (v/v) isopropanol (see Methods for further experimental details).


