
Figure 2.
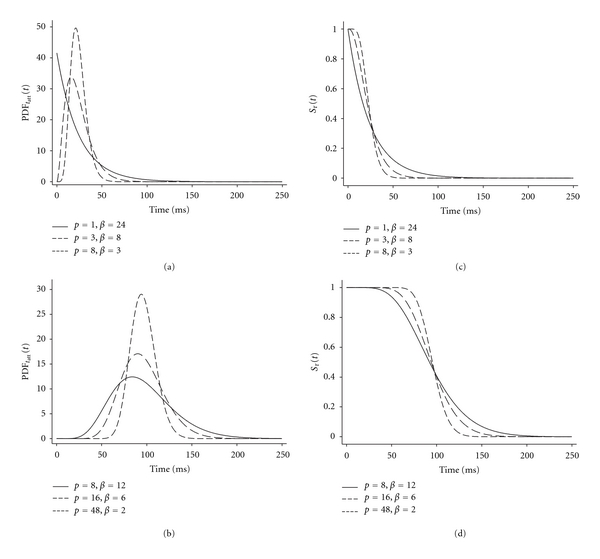
Examples of gamma distributions and associated survival functions. (a, b) The two parameters of the gamma distribution (p and β) permit description of a wide variety of distributions useful for representing the probability density function for myosin crossbridge attachment time, PDFtatt(t). Notably, a single exponential results when p = 1 (a), and a Gaussian distribution is approximated as p increases. (c, d) The survival function, Sτ(t), refers to the probability that an attached crossbridge will survive to time t. The analytical relationship between the PDFtatt(t) and Sτ(t) is provided by (10a) and (10b).