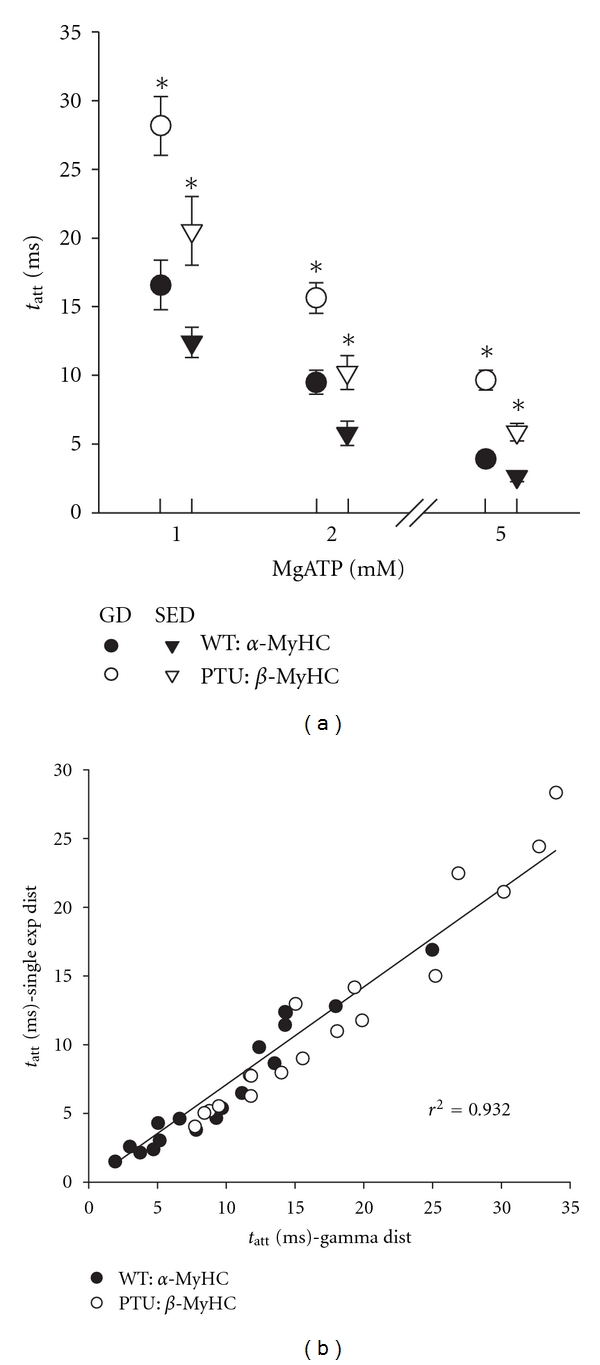
Figure 7.

Mean time of crossbridge attachment. (a) The mean time of crossbridge attachment using both models of PDFtatt(t) demonstrated a longer tatt for β-MyHC and a prolongation in tatt as MgATP was reduced. The two models agreed qualitatively in these respects, but did not agree quantitatively as estimates using the gamma distribution (GD) model were ~40% higher than those using the single exponential distribution model (SED). (b) Values for tatt using the two models correlated strongly. Despite the relative differences in the estimates of tatt, either model produces similar results for comparing the effects of isoform and MgATP. *P < 0.05 by t-test between MyHC isoforms at same MgATP.
