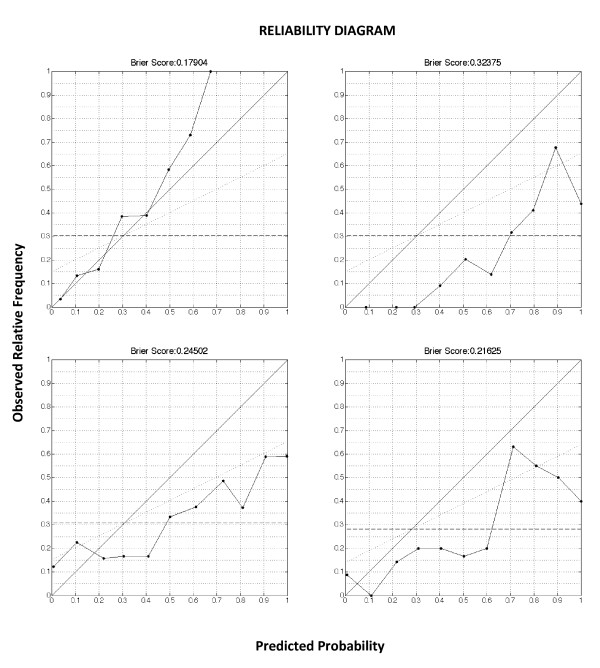
Figure 2.
Reliability diagrams of the classification task. The reliability curve plots the observed fraction of positives against the predicted fraction of positives. The diagonal indicates a perfect reliability. The dotted horizontal line is the no resolution line, indicating the mean prevalence of the outcome in the population. The Brier score can be expressed as the sum of three terms related to the components of a reliability diagram.
The first term, reliability, is the mean squared difference of the reliability curve to the diagonal. The second term, resolution, is the mean squared difference of the reliability curve to the no resolution line. The third term is a measure of uncertainty. N is the number of instances, s is the fraction of positives in the dataset, and for the kth bin, nk is the number of examples, pk is the predicted probability, and ok is the fraction of positives. Upper right panel. Validation cohort, 499 patients. Brier score and reliability diagram of the GP model. Upper left panel. Validation cohort, 499 patients. Brier score and reliability diagram of the EuroSCORE. Brier score was above the threshold of 0.25, and significantly higher (worse) than the GP models (p < 0.001). Lower right panel. Validation subcohort, 396 patients. Brier score and reliability diagram of the predictions by ICU nurses. Brier score was significantly higher (worse) than the GP models (p < 0.001). Lower left panel. Validation subcohort, 159 patients. Brier score and reliability diagram of the predictions by ICU doctors. Brier score was not significantly higher (worse) than the GP models (p = 0.055).

