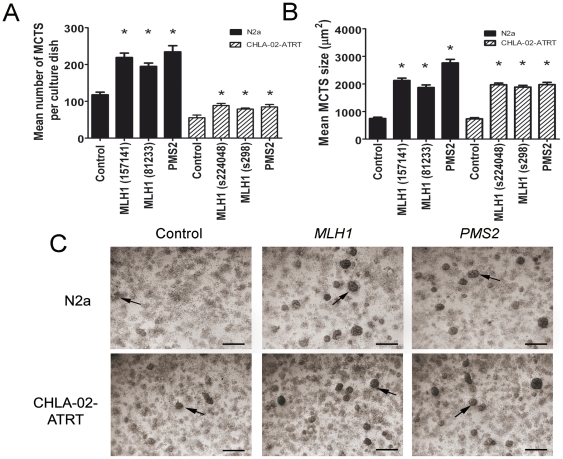
Figure 4. Silencing of MLH1 and PMS2 results in enhanced MCTS formation.
N2a and CHLA-02-ATRT cells at 50% confluence were transfected with 30 nM siRNA targeted against MLH1 and PMS2 and a negative control scrambled siRNA for a period of 5 hours. Cultures were incubated under standard conditions for a further period of 4 days. MCTS number and size were determined by light microscopy and image analysis. The silencing of MLH1 and PMS2 resulted in a significant increase in both the number (A) and size (B) of MCTS for both N2a and CHLA-02-ATRT cell lines. Statistical differences were calculated by One Way ANOVA between the negative control and MLH1/PMS2 targeted siRNA cultures. Each bar represents the mean +/− s.e.m. for at least three independent experiments. Significant differences (P<0.05) are indicated by the asterisks (*). (C) Representative low magnification light microscopy images showing cultures of N2a and CHLA-02-ATRT cells transfected with 30 nM negative control, MLH1 and PMS2 targeted siRNA. MCTS appear as dense 3-dimensional structures as indicated by the arrows. Images were obtained 4 days post-transfection. Scale bar represents 200 µm.

