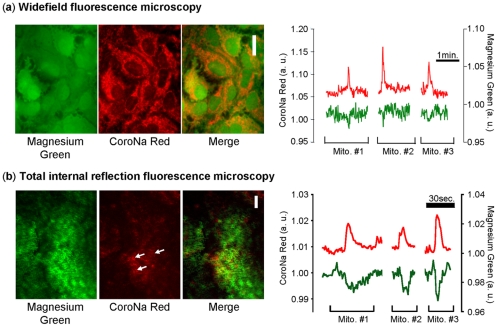
Figure 3. Mitochondrial Na+ transients are coincident with transient decrease in cytosolic Mg2+ concentration.
Astrocytes were loaded with Magnesium Green AM and CoroNa Red to monitor local free Mg2+ concentration and mitochondrial Na+ spikes. (a) Fluorescence images of astrocytes showing the typical cytosolic and mitochondrial patterns of Magnesium green and CoroNa Red, respectively observed under widefield microscopy. Experimental trace depicting spontaneous mitochondrial Na+ spikes (red trace, left axis) and free Mg2+ concentration (green trace, right axis). Scale bar: 20 µm (n = 6 exp, 24 mitochondria). (b) Fluorescence images of an astrocyte showing the fluorescence patterns of Magnesium green and CoroNa Red, respectively observed under TIRF microscopy. White arrows indicate where mitochondria are almost entirely located in the field of the evanescent wave. Experimental trace depicting spontaneous mitochondrial Na+ spikes (red trace, left axis) and free Mg2+ concentration (green trace, right axis). Scale bar 10 µm (n = 5 exp, 19 mitochondria).

