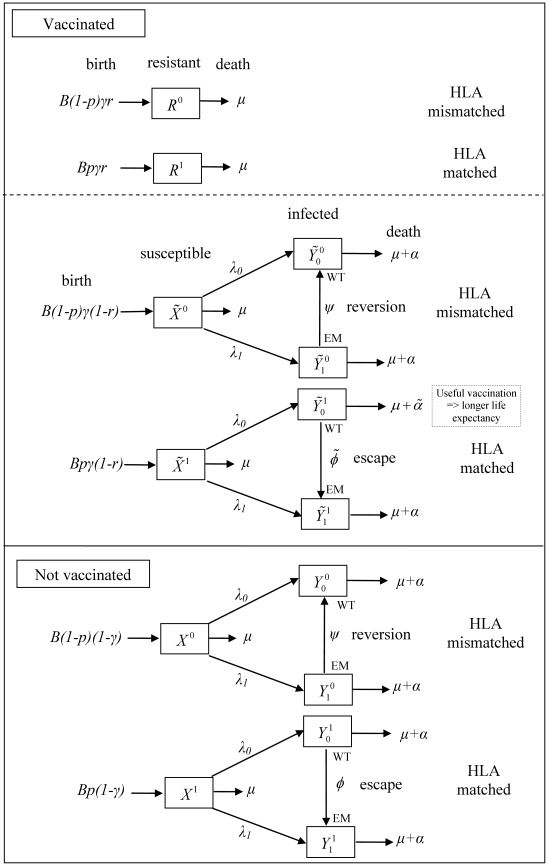
Figure 1. A schematic form of the single epitope version (n = 1) of the mathematical model of within-host evolution and between-host transmission of escape mutants in a vaccinated population.
In this model between-host transmission is modelled using a standard mathematical description of the frequency-dependent transmission of an infectious disease from which there is no recovery [29]. However, it includes extra stages of compartmentalisation representing whether the hosts are 1) HLA matched or mismatched for the epitope; 2) susceptible vaccinated, resistant vaccinated or unvaccinated and 3) whether the infected hosts have the wildtpe (WT) or the escape mutant (EM) strain. There are two additional processes: escape in HLA matched hosts infected with the wildtype strain and reversion in HLA mismatched hosts infected with the mutant strain. Escape occurs at rate  in vaccinated hosts and rate
  in unvaccinated hosts. Reversion occurs at rate
  in both host types. Infected vaccinated hosts who are HLA matched for the vaccine epitope and who do not have an escape mutant at that epitope have a longer life expectancy compared to other infected hosts (
 ). Such individuals are also less infectious so make a smaller per capita contribution to the force of infection (
 ). Thus the force of infection for wildtype virus is defined as
  and for escape mutant virus is defined as
  .
.

