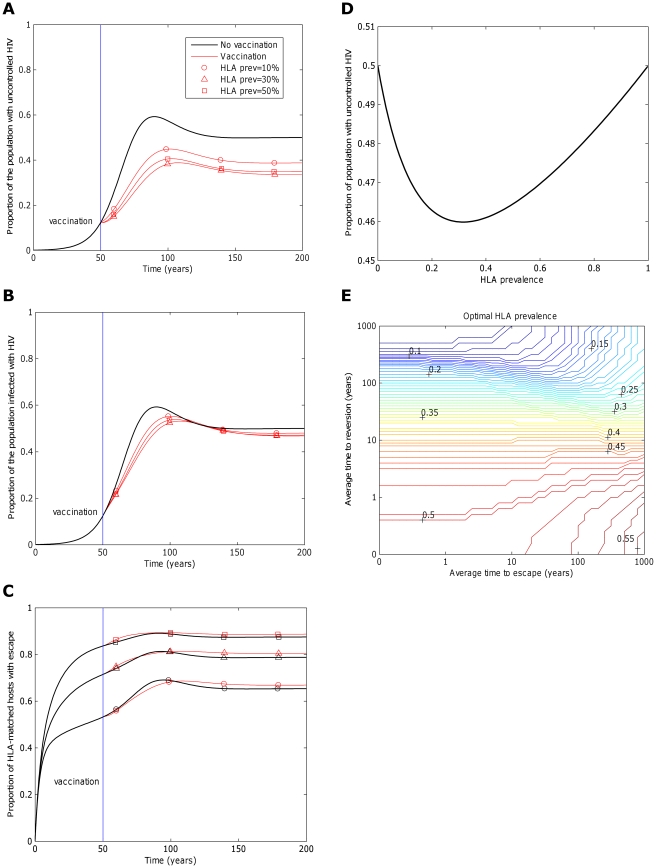
Figure 7. The impact of a vaccine varies with the fraction of the population that are HLA-matched for each epitope.
Panels A), B) and C) explore how the frequency with which epitopes are recognised in the population affects the impact of a five-epitope vaccine delivered to the population 50 years into an epidemic. Model simulations are presented under different assumptions about the fraction of the population that is HLA match for each of the five epitopes: 10% (circles), 30% (triangles) and 50% (squares). Escape takes an average of 8 years at each epitope in both vaccinated an unvaccinated hosts ( years−1 for i = 1∶5). Reversion takes an average of 36 years at each epitope in both vaccinated an unvaccinated hosts (
 years−1 for i = 1∶5). A) shows the proportion of hosts with uncontrolled HIV. B) shows the proportion of hosts infected with HIV. C) shows the escape prevalence amongst HLA-matched hosts. The impact of vaccination (red lines) is compared to the scenario where vaccination is absent (black lines). C) reveals that the prevalence of escape amongst HLA-matched hosts at each epitope would be higher if the restricting HLA is more prevalent. However, escape prevalence is not the only factor which contributes to vaccine impact since epitopes restricted by more prevalent HLAs will also provide protection to a greater fraction of the population. A) and B) reveal that an intermediate HLA prevalence (30% in this example, triangles) can optimise vaccine impact. This result is demonstrated more explicitly in panel D) in which the prevalence of uncontrolled infection for the single-epitope version of the model 200 years into an epidemic is used to explore the effect of HLA prevalence upon vaccine impact . D) shows that uncontrolled infection prevalence is a u-shaped function of the restricting HLA prevalence, thus is minimised at intermediate HLA prevalences. In this example (
 year−1 and
  years−1) vaccine impact is optimised when 32% of the population are HLA matched for the epitope. E) shows that the HLA prevalence that maximises vaccine impact 200 years into an epidemic is dependent upon the rate of escape in HLA matched hosts (
 ) and rates of reversion in HLA mismatched hosts (
 ). The assumptions and parameters used in these figure are the same as those described for Figure 2, except that the infectiousness and life expectancy of successfully vaccinated hosts are fixed at
  and
and  , respectively (
 ).
).

