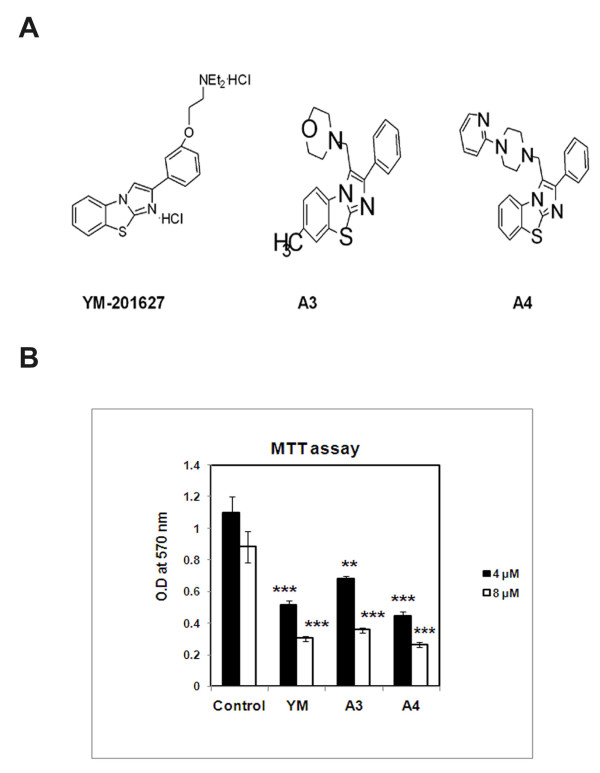
Figure 1.
Effect of benzothiazole based compounds on cell viability. (A) Chemical structures of YM, A3 and A4 compounds. (B) The HepG2 cells were subjected to compound treatments YM, A3, A4 at 4 and 8 μM concentrations for 24h. MTT assay was carried out and the O.D a 570 nm values are recorded which represents viable cells left over after compound treatment. Each experiment was conducted three times. The p values are derived in compound treated cells and are statistically significant when compared to control untreated cells. ** indicates p < 0.05 and *** indicates p < 0.001.

