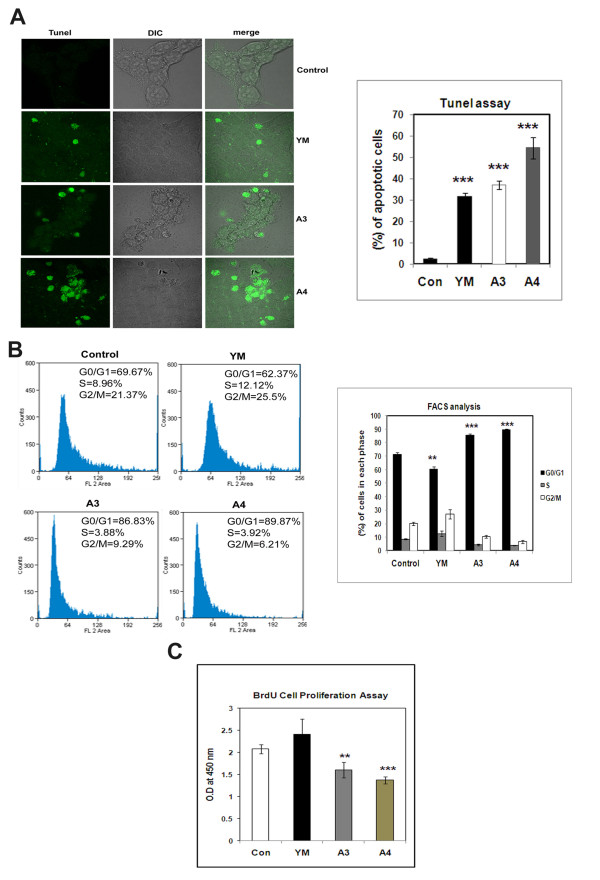
Figure 3.
Effect of Benzothiazole based compounds on DNA fragmentation and cell cycle in HepG2 cells. (A) HepG2 cells were treated with compounds YM, A3 and A4 at a concentration of 4 μM for a time period of 24 h. The standard compound used here in this study is YM. The fragmented DNA was bind to antibody conjugated to FITC. The fluorescence was detected and imaged using confocal microscope. The results obtained were the mean of three independent experiments and were found to be statistically significant with p-value <0.001. (B) FACS analysis was conducted after treatment of HepG2 cells with compounds YM, A3, A4 at a final concentration of 4 μM for 24 h.The standard compound used here in this study YM. YM has shown G2/M cell cycle arrest. A3 and A4 compounds have shown clear G1 cell cycle arrest. Each experiment was repeated three times and the results were statistically significant with p-value <0.01 for YM, <0.001 for A3 and A4. (C) The HepG2 cells were treated with YM, A3 and A4 compounds for 24 h. The cells were subjected to BrdU incorporation where in proliferating cells from G1 to S-phase of cell cycle accumulate more BrdU than those of G1 arrested cells. Here the BrdU antibody was added and was detected by secondary HRP antibody. O.D at 450 nm will give the amount of BrdU incorporated. The p values are derived in compound treated cells when compared to control cells and are statistically significant with the p-value of <0.01 for A3 and <0.001 for A4.

