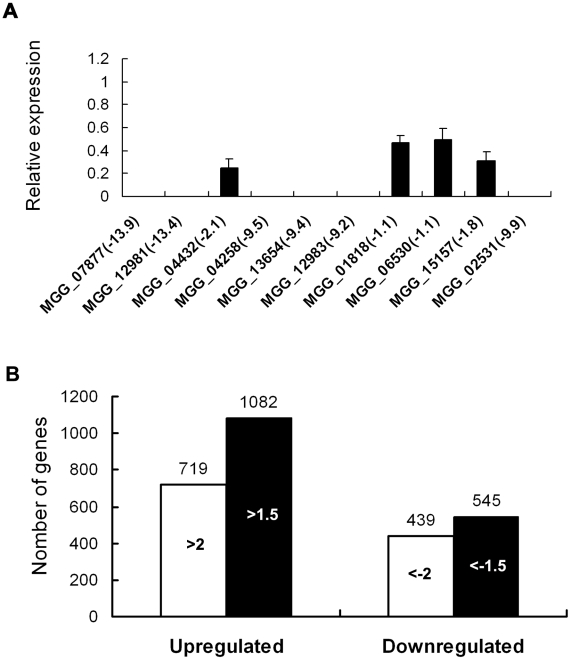
Figure 10. Differential gene expression analysis on transcriptomes of the Δmosom1 mutant and Guy11 strains.
(A) qRT-PCR validated the SAGE results. qRT-PCR was carried out to confirm the SAGE results through random selection of ten genes that were down-regulated in the Δmosom1 mutant (SK27). The value of log2 ratio (Δmosom1/Guy11) is in bracket after gene ID number. The level of gene expression in Guy11 was taken as 1 and the relative expression in SK27 mutant was normalized based on 1. Error bars represent the standard deviation. (B) Numbers of altered genes expressing in Δmosom1 mutant. >2.0 or >1.5, genes whose expression were up-regulated as indicated by expression profiling and the log2 ratio (Δmosom1/Guy11) values were more than 2 or 1.5; <−2 or <−1.5, genes whose expression were down-regulated as indicated by expression profiling and the log2 ratio (Δmosom1/Guy11) values were less than −2 or −1.5.

