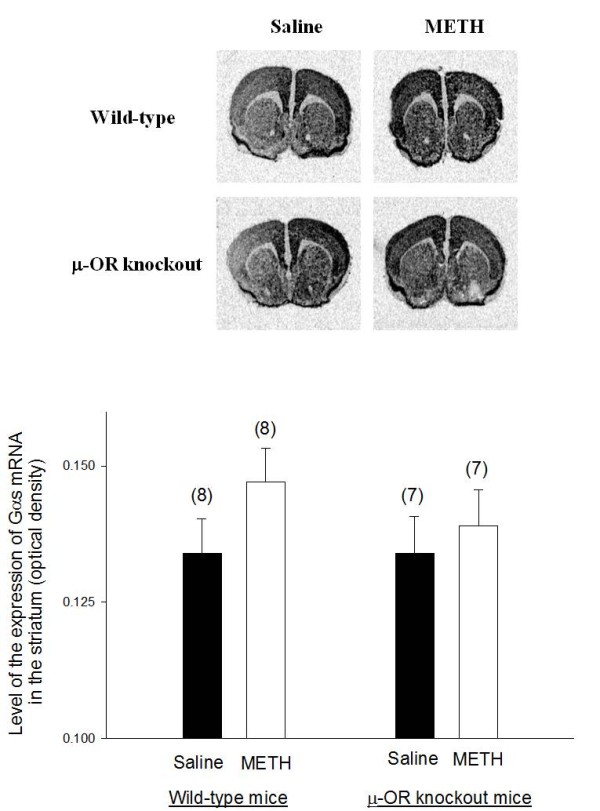
Figure 3.

The expression of Gαs mRNA in the brains of METH-sensitized wild-type and μ-OR knockout mice. The expression of Gαs mRNA in the brains of METH-sensitized wild-type and μ-OR knockout mice. Animal treatments were the same as described in Fig. 2. Gαs mRNA levels in the brain sections were analyzed by in situ hybridization analysis. Representative autoradiograms of Gαs mRNA expression in the brain of mice are presented at the top of the figure. Mean values ± SEM are presented. Numbers in parentheses represent the number of animals/brains studied.
