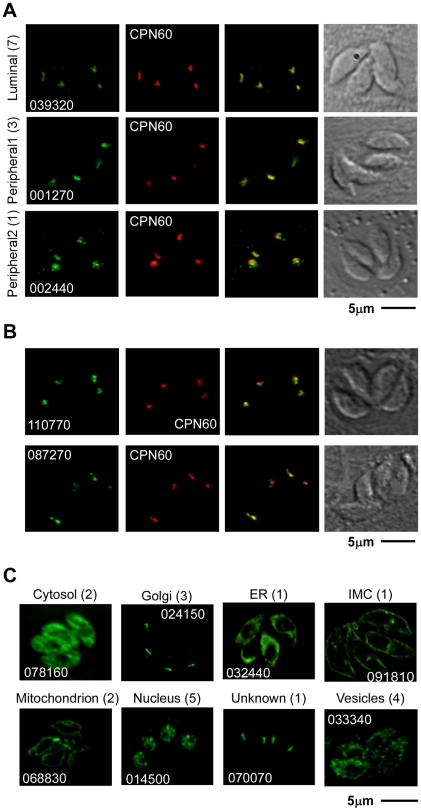
Figure 2. Localization of 30 previously uncharacterized proteins by endogenous epitope tagging.
Fluorescence microscopy analysis of parasites expressing endogenously HA-tagged proteins. (A) shows examples of a luminal apicoplast protein (top panel), a protein localizing to the periphery of the apicoplast (middle panel), and an example for the second patchy peripheral pattern observed (bottom panel). Numbers on the left represent the numbers of proteins showing the described pattern. (B) shows representative image of ATrx2 (top panel) and of PPP1 (bottom panel) localizations. (C) Representative images of tags that resulted in the identification of non-apicoplast proteins. Likely target organelles are indicated. Scale bar = 5 µm. HA in green, CPN60 in red, numbers reflect the ToxoDB gene ID as detailed in the Results section.

