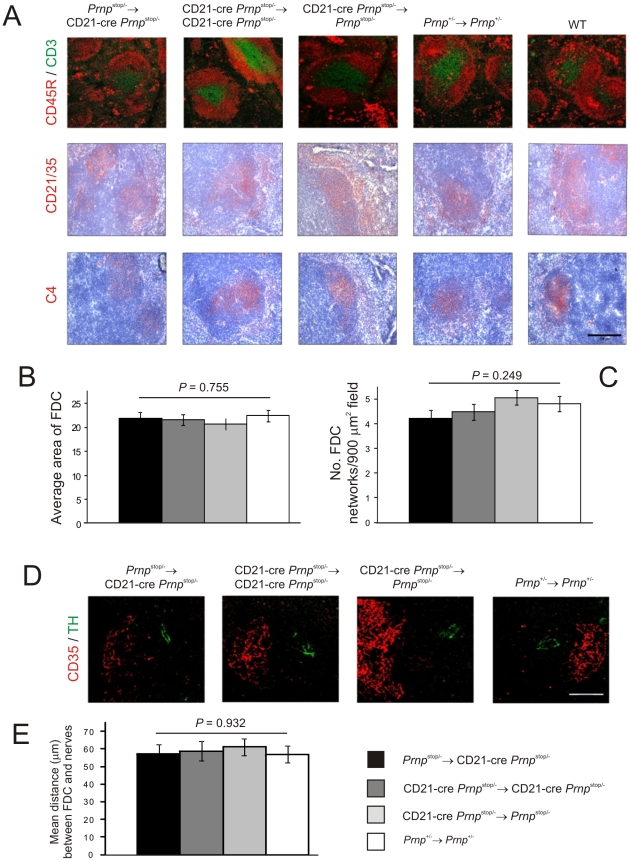
Figure 3. Effect of FDC-restricted PrPc expression on the spleens of Prnp stop/-→CD21-Cre Prnp stop/- mice.
A) IHC analysis of the status of FDC networks (C4-binding cells and CD21/CD35+ cells; red), B cells expressing CD45R (red), and CD3+ T cells (green). Morphometric analysis confirmed that there were no significant difference in the size (B) and number (C) of the CD35+ FDC networks in spleens from Prnp stop/-→CD21-Cre Prnp stop/-, CD21-Cre Prnp stop/-→CD21-Cre Prnp stop/-, CD21-Cre Prnp stop/-→Prnp stop/- mice and Prnp +/-→Prnp +/- control mice (n = 32 FDC networks/group). D and E), Comparison of the sympathetic innervation in spleens from each mouse group. D) IHC detection of TH-positive sympathetic nerves (green) and FDCs (CD35+ cells; red). Scale bar, 50 µm. E) Quantitative analysis of the relative positioning of the FDC and sympathetic nerves showed there were no significant differences in average distance between these cell populations in spleens from each mouse group (P = 0.932, n = 48 FDC networks/group). For all panels n = 6 mice/group.

