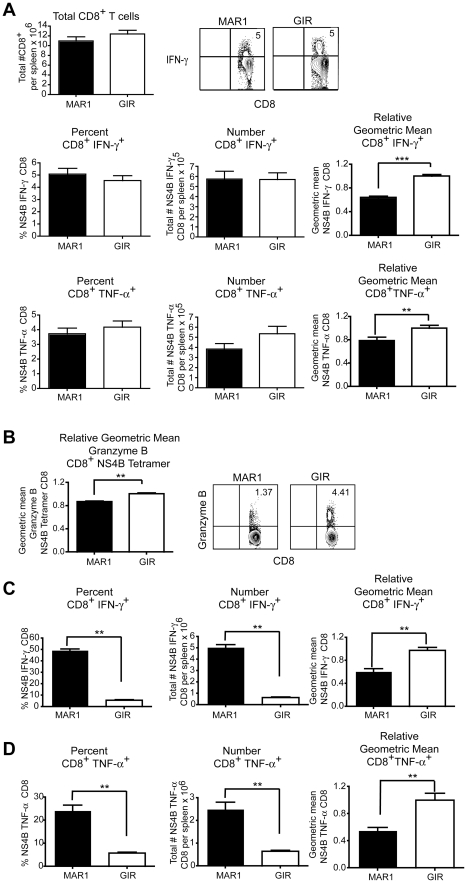
Figure 2. Effect of treatment of MAR1-5A3 on WNV-specific CD8+ T cell responses.
A-B. Mice were infected with 102 PFU of WNV-NY and treated with 1 mg of MAR1-5A3 or GIR-208 (GIR) at day 4 post infection. A. Analysis of the CD8+ T cell from the spleen of infected MAb-treated mice (n = 20 to 25 per group). Splenocytes were harvested on day 9 after WNV infection, and intracellular cytokine staining of IFN-γ and TNF-α was analyzed in CD8+ T cells after ex vivo restimulation with NS4B peptide. (Top left) Total number of splenic CD8+ T cells after infection and treatment with MAbs. (Top right) A representative contour plot showing intracellular IFN-γ levels on CD8+ T cells after MAb treatment is shown. The percentage, number, and relative staining of WNV-specific IFN-γ+ CD8+ T cells (middle panels) or WNV-specific TNF-α+ CD8+ T cells (bottom panels) are shown. Relative intracellular cytokine staining reflects pooling of data from independent experiments after normalization within a given experiment. B. The levels of intracellular granzyme B in WNV-specific CD8+ T cells were assessed by co-staining with Db-NS4B tetramer and antibodies to granzyme B (n = 6 mice per group). A representative contour plot showing intracellular granzyme B levels on CD8+ T cells after MAb treatment is shown. C–D. Mice were infected with 102 PFU of WNV-MAD and treated with 1 mg of MAR1-5A3 or GIR-208 (GIR) at day -1 and +4 relative to infection. The percentage, number, and relative staining of WNV-specific (C) IFN-γ+ CD8+ T cells or (D) TNF-α+ CD8+ T cells are shown (n = 5 mice per group). Asterisks indicate differences that are statistically significant (*, P<0.05; **, P<0.01, ***, P<0.001).

