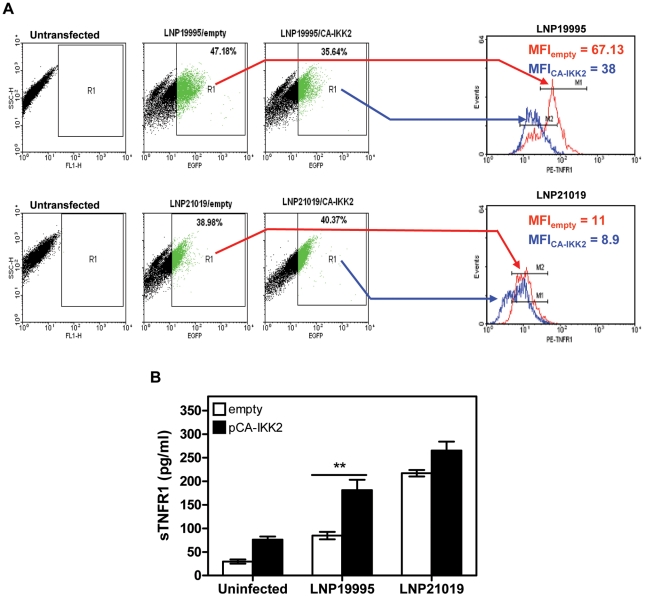
Figure 6. Constitutive activation of NF-κB decreased surface expression of TNFR1 and increased sTNFR1 shedding.
(A) Analysis of surface expression of TNFR1. FACS analysis of GFP-transfeted cells. Hec-1B cells were transfected with the pCA-IKK2-GFP (in blue) or empty vector control pCMV-GFP (in red). Cells were then infected with either LNP19995 or LNP21019. After infection cells were surface-stained for TNFR1 using specific anti-TNFR1 mAb followed by phycoerythryn (PE)-conjugated secondary Ab. Dot plots in the left panel show the percentages of GFP+ subpopulation (FL1 channel) within the total cells incubated with LNP19995 or LNP21019 relative to untransfected cells. GFP+ events were gated as region R1 and surface expression of TNFR1 (FL2 channel) was analyzed within this GFP+ subpopulation. Histogram plots (right panels) show the level of TNFR1 at the surface of LNP19995 infected or LNP21019-infected cells. TNFR1 levels were expressed as the mean fluorescence intensities (MFI) relative to unstained cells. The histograms corresponding to each gated region is indicated by arrows. (B) sTNFR1 was assayed by ELISA after exposure of pCA-IKK2-(closed bars) or empty vector-transfected (open bars) Hec-1B cells to LNP19995 or LNP21019. Data represent the mean ± S.D. from three independent experiments, each performed in duplicates. **, P<0.01 of CA-IKK2-transfected cells compared with empty vector control-transfected cells.

