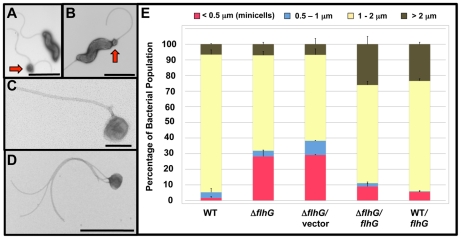
Figure 2. Analysis of the minicell phenotype upon deletion of flhG in C. jejuni.
(A-D) Electron micrographs of negatively stained C. jejuni ΔflhG cell bodies and minicells. Bars = 2 µm (A and B), 0.2 µm (C), and 1 µm (D). Red arrows indicate minicells next to normal size bacteria (A) or forming at a pole of a bacterium (B). (E) Quantification of lengths of cell bodies of wild-type C. jejuni and ΔflhG mutant populations. The lengths of the cell bodies of bacteria were measured. Wild-type C. jejuni and C. jejuni ΔflhG mutant were complemented with vector alone, or vector expressing wild-type flhG. The data are reported as the percentage of bacterial populations with the following cell lengths:<0.5 µm, minicells (red); 0.5–1 µm (blue); 1–2 µm (yellow); and >2 µm (brown). The data represent the average of two experiments. Bars represent standard errors.

