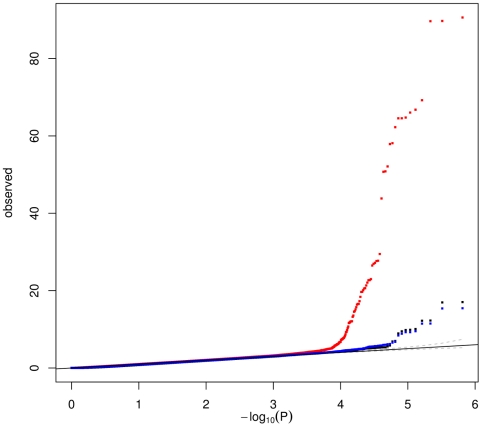
Figure 5. Quantile–quantile plot comparing the associations of 675,350 SNPs with patterns obtained by ICA (64 patterns – red) and module eigengenes (MEs) obtained by WGCNA with default (26 MEs – black ) or tuned parameters (71 MEs – blue).
For each SNP, the best P-value over the 26 or 71 MEs and the 64 ICA patterns, respectively, is shown. A Sidak correction was applied to correct for the number of MEs (patterns, resp.) tested.

