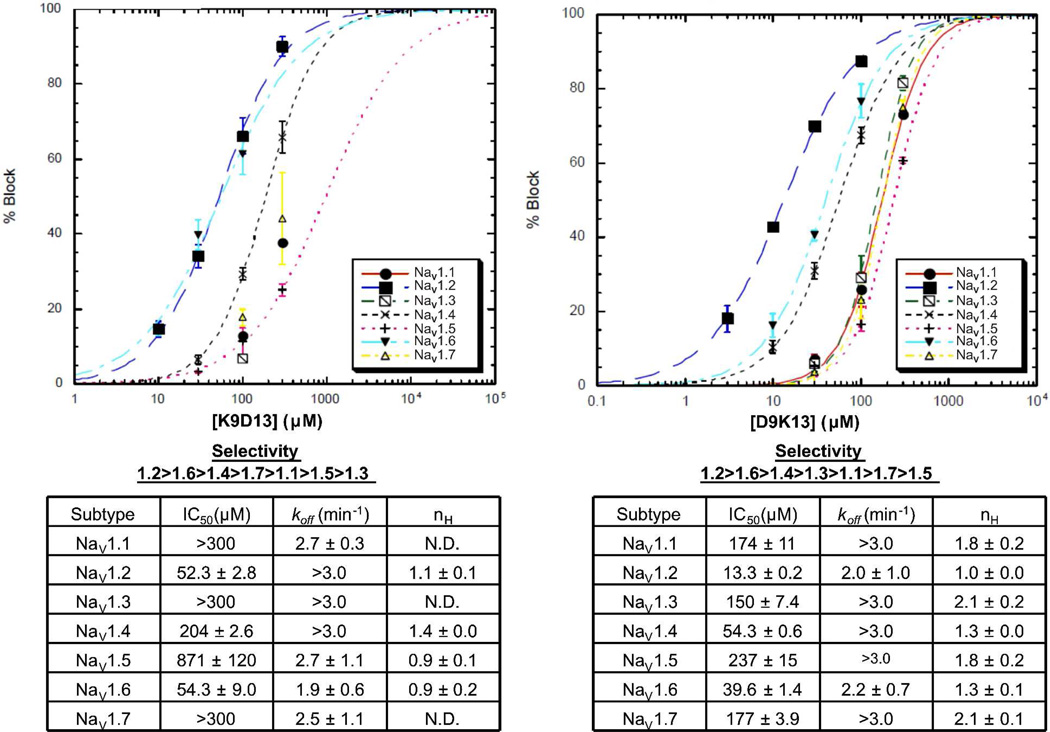
Fig.5.
Dose-response curves for K9D13 (left) and D9K13 (right) tested against NaV1.1 through 1.7 expressed in Xenopus oocytes. Curves represent fits of data to the Hill equation, % Block = 100 × 1/(1 + (IC50/[peptide])nH), where % Block was measured by voltage clamp protocols described in Experimental procedures. Data could not be fit for K9D13 with NaV1.1, 1.3 and 1.7; instead their IC50 values (">300 µM") were estimated by visual inspection. koff was determined from single-exponential fits of the time course of recovery from block following toxin washout. Values represent mean ± S.E.M (N ≥ 3 oocytes). In those instances where the kinetics of peptide washout were too fast to be accurately measured, an estimated lower limit for koff (>3.0 min−1) is indicated.

