
Figure 1.
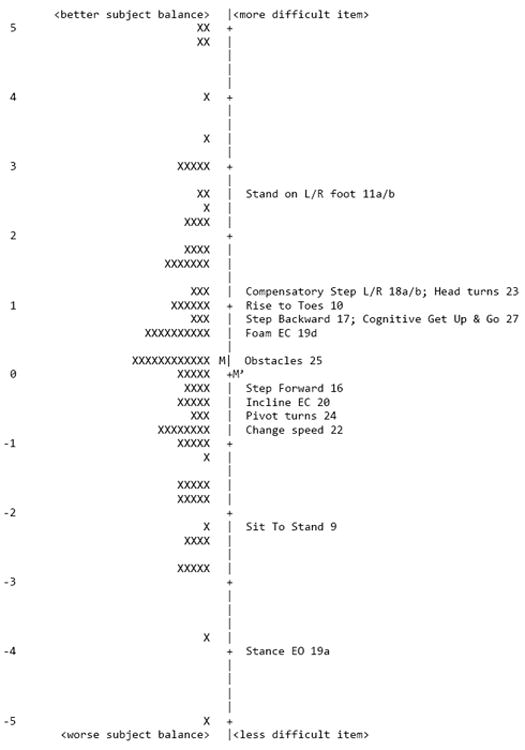
Subject-ability and item-difficulty maps of the mini-BESTest (n=115). In both maps, the vertical line represents the measure of the variable, in linear logit units. The left-hand column locates each patient’s ability, from best to worst dynamic balance. The right-hand column locates each item’s relative difficulty for this sample (for each item, the difficulty estimate represents the mean calibration of the threshold parameters according to the partial credit model). From bottom to top, measures indicate better balance for patients and higher difficulty for items. By convention, the average difficulty of items in the test is set at 0 logits (and indicated with M’) and patients with average ability are located at M.