
Figure 2.
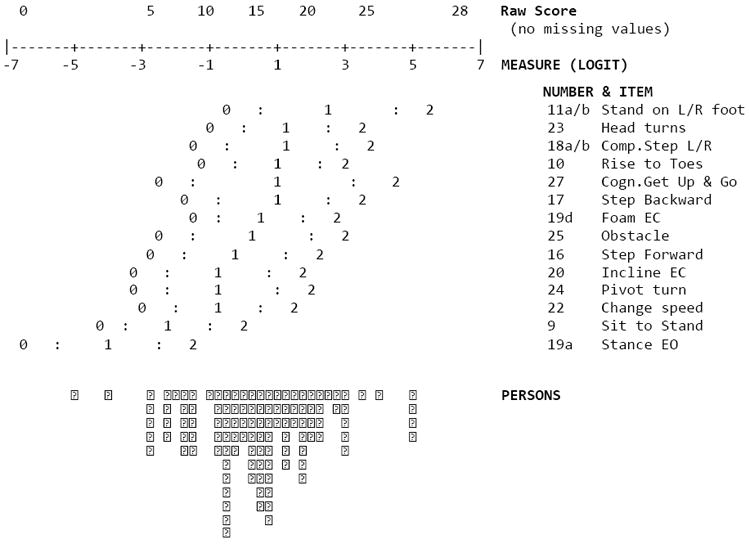
Expected scores for the mini-BESTest (n=115). Distance between points is equal-interval. Logit measure at top of key, centered at the mean item difficulty. The rating scale is collapsed from 4 to 3 categories renumbered 0 (severely impaired), 1 (moderately impaired), 2 (normal). The threshold between adjacent categories is marked by ‘:’. At the bottom is the distribution of the person measures (subject ability): each marker is a single person.