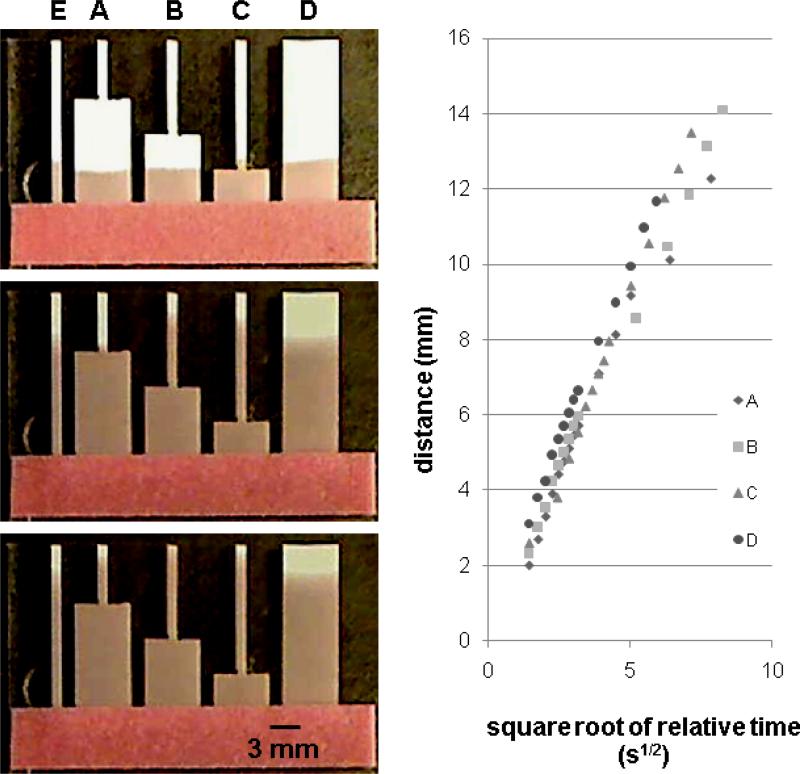
Figure 2.
Transport of fluids during wet-out for strips in which there is a sudden - contraction of the width of the strip. The plot shows the distance moved by the fluid front vs. in the first segment and distance vs. in the second segment for each strip. Comparison of the positions of the fluid fronts between the different strips in the image series and the plot indicate that the fluid front moves the fastest for the configuration in which the two lengths are closest to being equal, strip B at the time of the middle image (see Supplementary Information, Section C). The data indicate that fluid front displacement in the smaller-width segment follows a Washburn equation in terms of the relative time since the fluid front passed the segment transition, with a slope that is similar to the Washburn slope in the wider segment.

