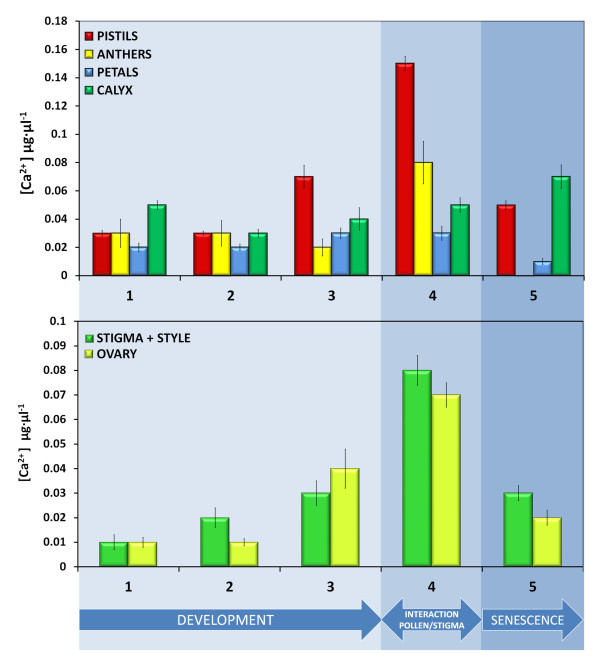
Figure 2.
The Ca2+ content (μg·μl-1) of olive floral organs during flower development. (A) Ca2+ content in the extracts from pistils (black bars), anthers (white bars), petals (light gray bars) and calyx (dark gray bars). Values are mean ± SD values of 3 independent experiments. (B) Comparison of Ca2+ pools from pistil upper parts (stigma with style; black bars) and ovary (light gray bars) at different stages of olive flower development.

