
Figure 2.
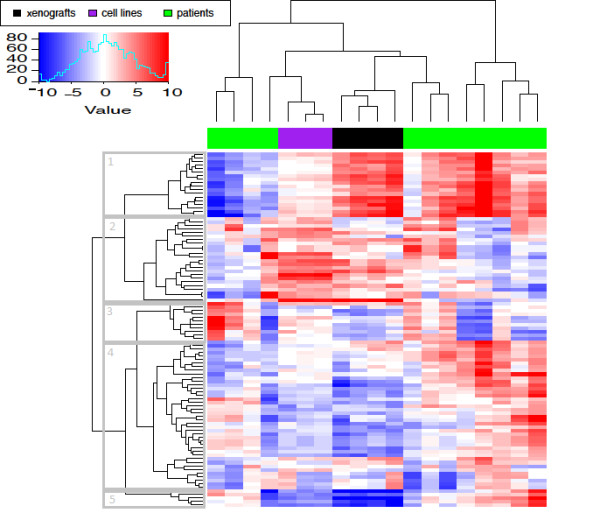
Parametric GSEA of combined top 100 glucocorticoid-induced gene sets with greatest variance from xenograft, patient and cell line models. Hierarchical clustering with gene sets in rows, samples in columns (xenografts - black, patient - green, cell line - purple). Each colour of each cell represents the Z-score (see legend). Boxes 1-5 represent defined clusters.