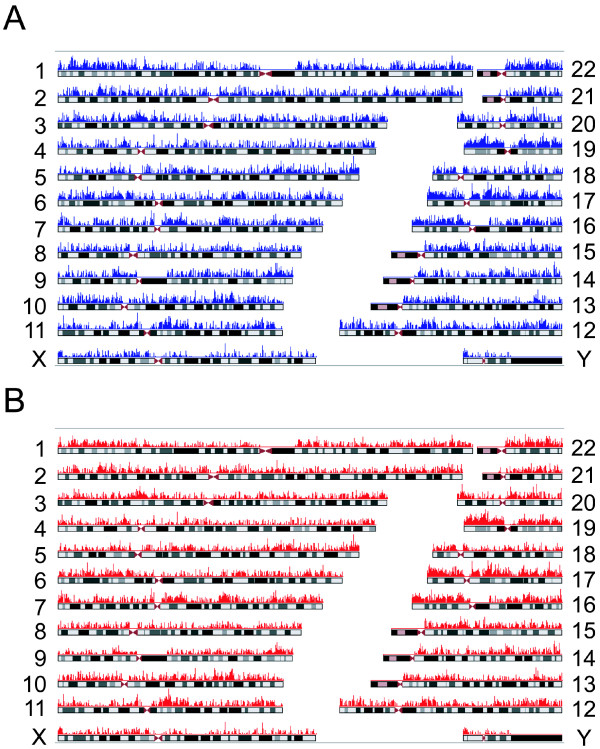
Figure 4.
Density distributions of captured sequences mapped on chromosomes. The lengths of genomic sequences (blue or red peaks) mapped within 10-kb non-overlapping windows were plotted along chromosomes 1-22, X and Y using Human Genome Graphs (http://genome.ucsc.edu/cgi-bin/hgGenome) for (A) white blood cell DNA and (B) glioma DNA.

