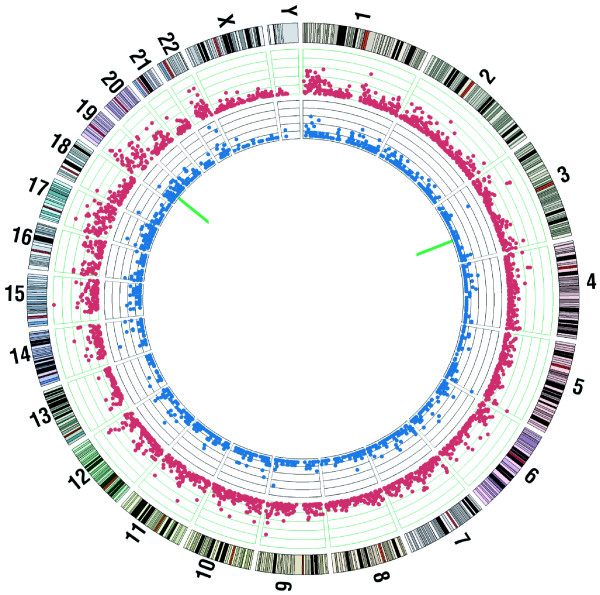
Figure 5.
Genetic variations identified in the white blood cell genome relative to the reference human genome. From the outside, Tracks 1 and 2: numbering and cytobands of different chromosomes. Track 3: red dots showing number of SNVs per 1 Mb window (scale: 0-60, 1 div = 12). Track 4: blue dots showing number of indels of ≤ 30 bp per 1 Mb window (scale: 0-12, 1 div = 2.4). Inner circle: green bars showing positions of structural variations in the form of two large indels at chromosomes 3 and 19. The figure was drawn using the Circos program [29].

