
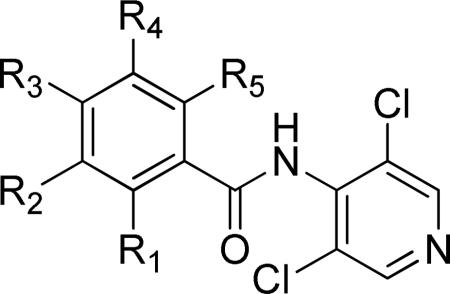
Table 2.
SAR studies of piclamilast analogs.
 | |||||||||
|---|---|---|---|---|---|---|---|---|---|
| Entry | Cmpd | R1 | R2 | R3 | R4 | R5 | TbrPDEB1 IC50 (μM)a | TbrPDEB2 IC50 (μM)a | T. brucei EC50 (μM) |
| 1 | 1 | H |
|
OMe | H | H | 4.7 ± 1.0 | 11.4± 1.1 | 9.6 ± 0.9 |
| 2 | 10 22 | H | OMe | OMe | H | H | >100 | >100 | |
| 3 | 11 | H | OEt | OMe | H | H | 16.5±3.4 | 34.0±0.9 | |
| 4 | 12 | H | OPr | OMe | H | H | 13.6± 4.4 | 9.4±2.4 | 13.0±2.4 |
| 5 | 13 | H | OiPr | OMe | H | H | >30b | >30b | 27.6±7.1 |
| 6 | 14 22 | H | OBu | OMe | H | H | 7.7 ± 3.9 | 14.3±3.7 | 17.7±3.1 |
| 7 | 15 | H | OBn | OMe | H | H | 12.5±5.3 | 11.2±1.1 | 10.1±1.2 |
| 8 | 16 | H | OEt | OEt | H | H | >100 | nd | |
| 9 | 17 | H | OMe | OAc | H | H | >100 | nd | |
| 10 | 9 | H | OMe | OMe | OMe | H | >>100 | nd | >>100 |
| 11 | 18 | Cl | OMe | OMe | H | H | >>100 | nd | |
| 12 | 19 | H | OMe | OMe | H | Cl | >>100 | nd | |
a
IC50 values reported to be “>> x μM” if <25% inh at x μM; “> x μM” if 25-50% inh at x μM.
b
Measurement of a precise IC50 value was precluded by low compound solubility.