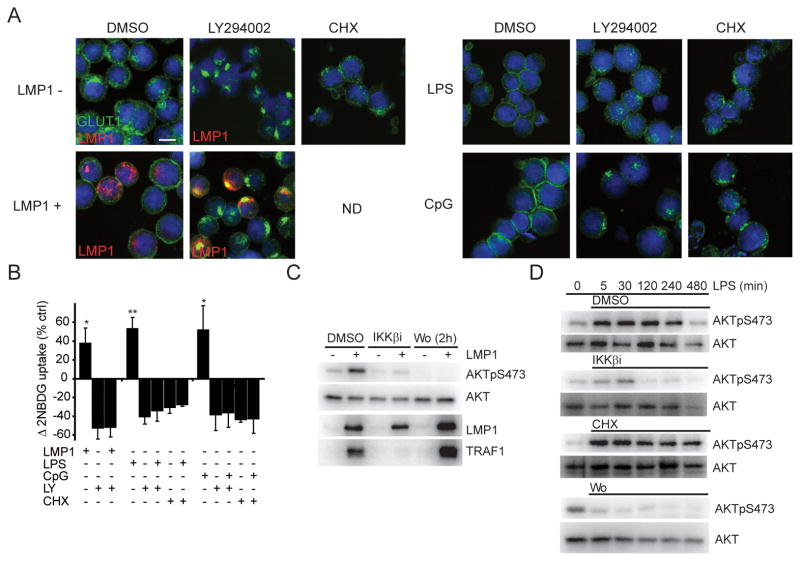
Figure 2. EBV LMP1-, LPS- and CpG- stimulated GLUT1 plasma membrane localization is dependent on AKT activation and continuous translation. AKT activation is both IKKβ and PI3K dependent.
(A) GLUT1 localization (green), DNA staining (blue), and where indicated, LMP1 expression (red) in BLtetLMP1 expressing LMP1 (24h), or stimulated with LPS (500ng/ml; 10h), or stimulated with CpG (250nM;10h). DMSO, LY294002 (LY;30μM) or CHX (10μg/ml) were included at 6h (LMP1) or 0h (LPS/CpG) where indicated. Bar=10μm. (B) Glucose/2NBDG import as in Figure 1A (n=3; mean±s.d., *p<0.05 /** p<0.005). (C) AKT activity in BLtetLMP1 induced to express LMP1 and treated with DMSO, IKKβi (10μM at 6h) or Wortmannin (Wo;1μM at 22h). At 24h, total cell lysates were analyzed for LMP1, AKT and AKTpS473. TRAF1 serves as an indicator of NFκB activity. (D) AKT activity in uninduced BLtetLMP1 pretreated with IKKβi, CHX or Wortmannin (Wo) for 15 min and then stimulated with LPS. Total cell lysates were prepared at the indicated times and analyzed for AKT and AKTpS473.

