
Fig. 3.
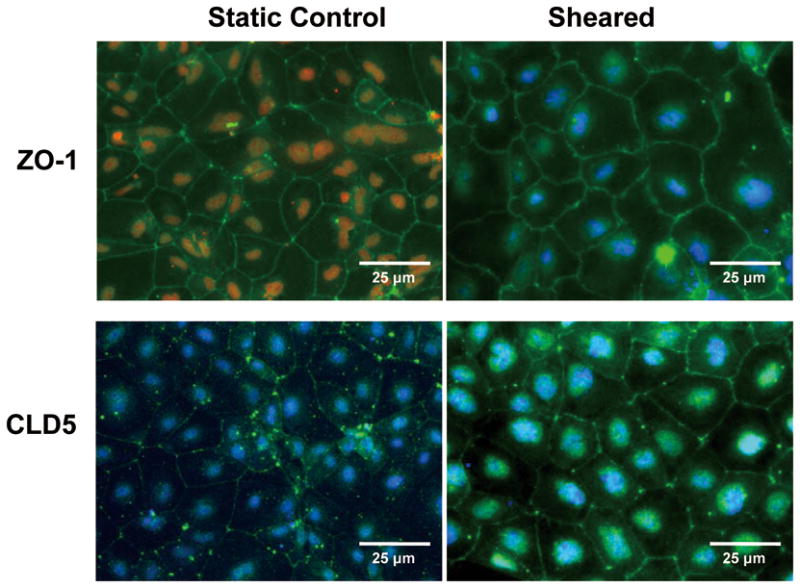
Immunofluorescence staining for ZO-1 and CLD5 in ESC-derived ECs before and after exposure to shear stress (5 dyn/cm2 for 8h). (Top panels) show that shear stress changed the distribution of ZO-1 from narrow border lines to a wider jagged pattern localized at the cell-cell junctions. (Lower panels) show shear stress increased expression of CLD5 at cell borders.