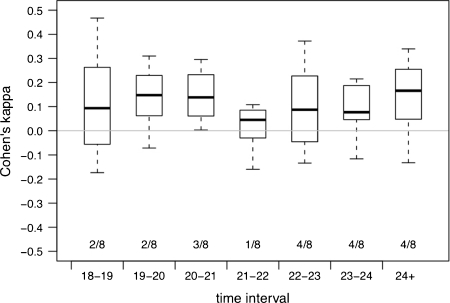
Fig. 2.
Boxplots of Cohen’s κ; 0 corresponds to independent behavior. Each boxplot summarizes the coefficients for the 8 pairs in a given time interval. The numbers (2/8, 2/8, …,4/8) represent the number of pairs for which the hypothesis of independent behavior is rejected at 10% level of significance using Fisher's test.

