Fig. 4.
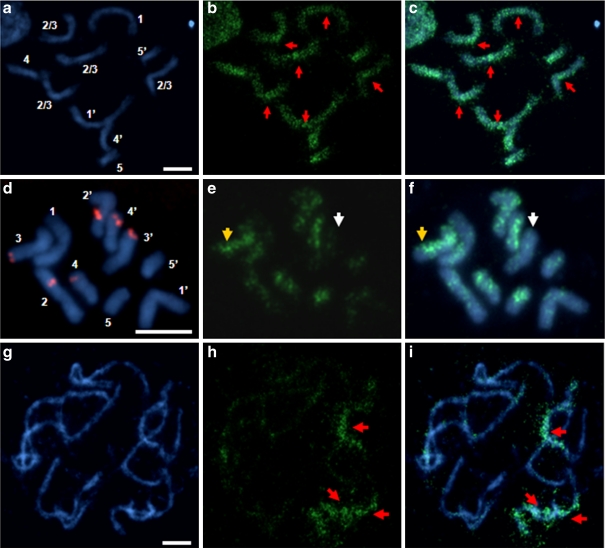
DNA methylation patterns on mitotic B. distachyon chromosomes after 5-AzaC treatment. a prometaphase chromosomes subjected to 0.001 mmol/L 5-AzaC. b Methylation pattern of the same chromosomes. Positions of centromeres are pointed out by arrows. d FISH with BAC clones ABR1-26-H1, ABR1-54-D7 and ABR1-32-C1 (red fluorescence) on metaphase chromosomes subjected to 0.01 mmol/L 5-AzaC. e Distribution of 5-MeC foci on the same chromosomes. g Prophase/prometaphase chromosomes after 0.1 mmol/L 5-AzaC treatment. h Methylation pattern of the same chromosomes. c, f, i Superimposed images of DAPI stained chromosomes and signals of 5-MeC residues. The arrows colour coding: red—very high; yellow—high and white—low methylation level. DAPI counterstaining, blue fluorescence. Bars 5 μm

