
Fig. 3.
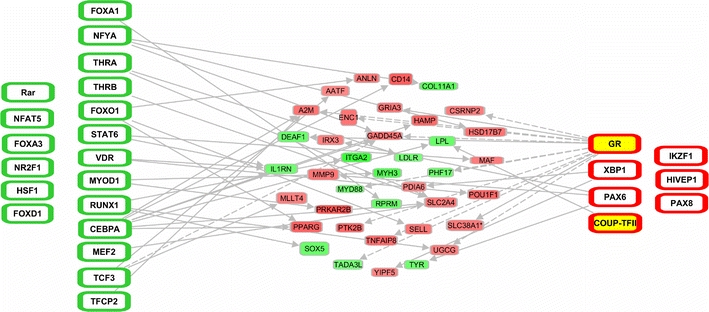
Linking of TFs identified by protein/DNA array to differentially expressed genes. TFs that show less (green outline) or more (red outline) DNA-binding activity in post-MI LV tissue are depicted at the far left and right and are connected with upregulated (red) and downregulated (green) genes depicted in the center. TFs in yellow show matching changes in both protein/DNA array and TFBS analysis. A line was drawn between a TF and a gene if it was known from the literature that the TF can cause the expression of the gene. Uninterrupted and dashed lines indicate physical and indirect interactions between molecules