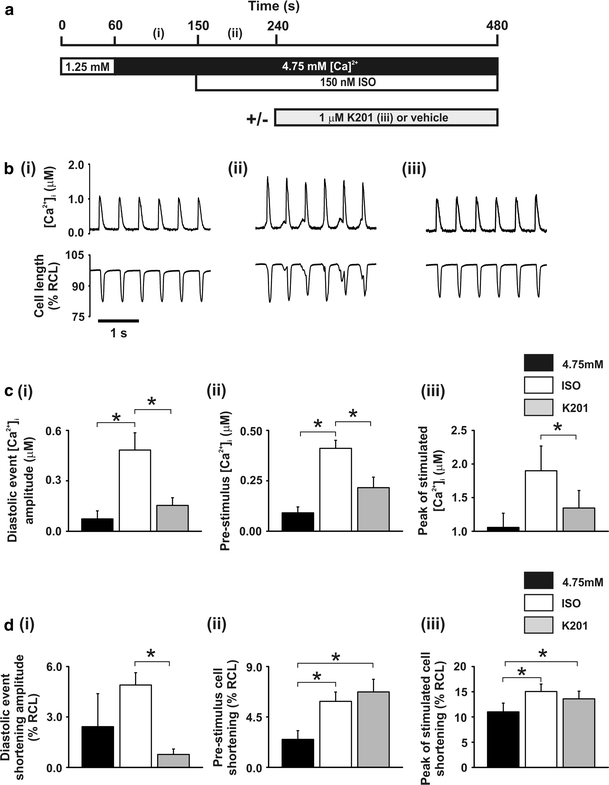
Fig. 1.

Effect of 1.0 μmol/L K201 on [Ca2+]i and cell shortening a perfusion protocol. b records of [Ca2+]i (upper) and cell length (lower) at points denoted in a. c mean ± SEM values of for (i) diastolic event free [Ca2+]i amplitude, (ii) pre-stimulus free [Ca2+]i and (iii) peak free [Ca2+]i of stimulated transient. d mean ± SEM values of cell shortening for (i) diastolic event amplitude, (ii) pre-stimulus and (iii) peak of stimulated transient. Black bars, 4.75: 4.75 mmol/L [Ca2+]o; White bars, ISO: 4.75 mmol/L [Ca2+]o + 150 nmol/L ISO; Grey bars, K201: 4.75 mmol/L [Ca2+]o + 150 nmol/L ISO + 1.0 μmol/L K201; n = 8, *P < 0.05
