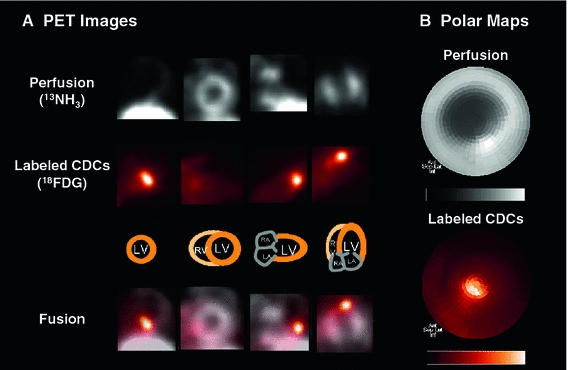
Fig. 1.

Integration of cell tracking and myocardial perfusion imaging. a Reangulated tomographic PET images of myocardial perfusion (13NH3, grey scale) and [18F]-FDG-labeled cardiosphere-derived cells (CDCs; hot metal scale), 1 h after intramyocardial CDC injection in a rat model of acute myocardial infarction. Fusion images confirm CDC injection and retention in the hypoperfused apical infarct border zone. b Matching polar maps of perfusion and the [18F]-FDG-labeled CDC signal, created by use of identical search rays. Polar maps are a two-dimensional displays of three-dimensional tracer distribution throughout the myocardium, showing anterior wall on top, inferior wall on bottom, septum on left, lateral wall on right, base in the periphery and apex in the center
