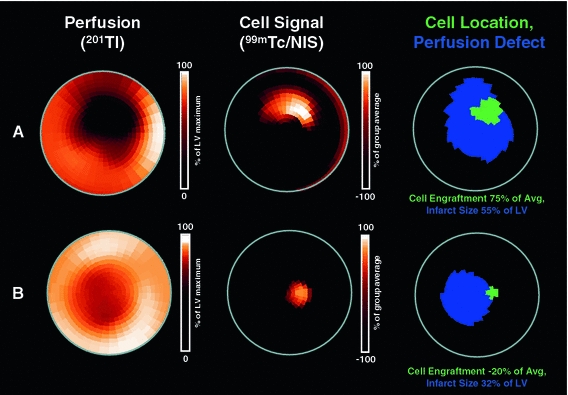
Fig. 3.

Polar map analysis of perfusion defect and 24-h engraftment of NIS-labeled cardiosphere-derived cells. Shown are polar maps of SPECT images in representative infarct animal with a large (a) and small (b) infarct. Polar maps of myocardial perfusion (left, measured by 201Tl), the co-registered cell signal (middle, obtained by injection of the reporter probe 99mTc), and of a result map showing the perfusion defect in blue and the cell location in green (right) are displayed. Note that the cell signal is located in the infarct border zone in both cases. Consistent with analysis of the entire group, and in contrast to early retention (Fig. 2), semiquantitative cell signal strength is higher in the larger infarct
