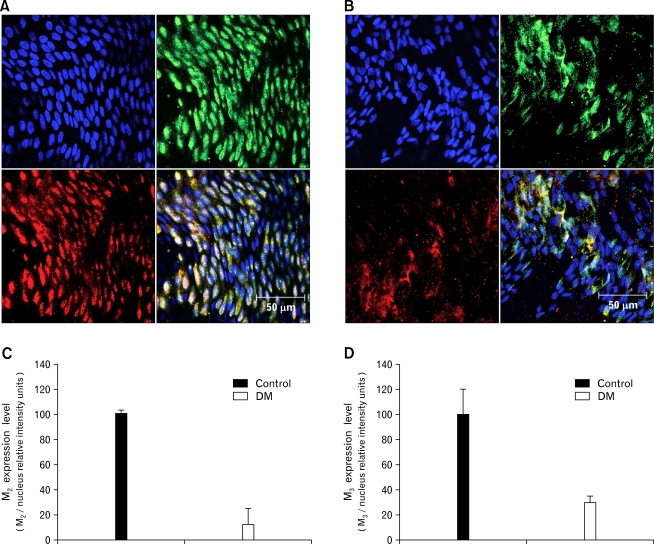
Figure 4.
Expression of M2 and M3 muscarinic receptors in control (A) and diabetes mellitus (DM) (B) rats. Blue: nuclei, Green: M2 receptors, Red: M3 receptors (representative data from n = 6). Co-localization of M2 and nuclei in the control and DM rats (C). Co-localization of M3 and nuclei in control and DM rats (D). Values are expressed as the means ± SEM (n = 6).

