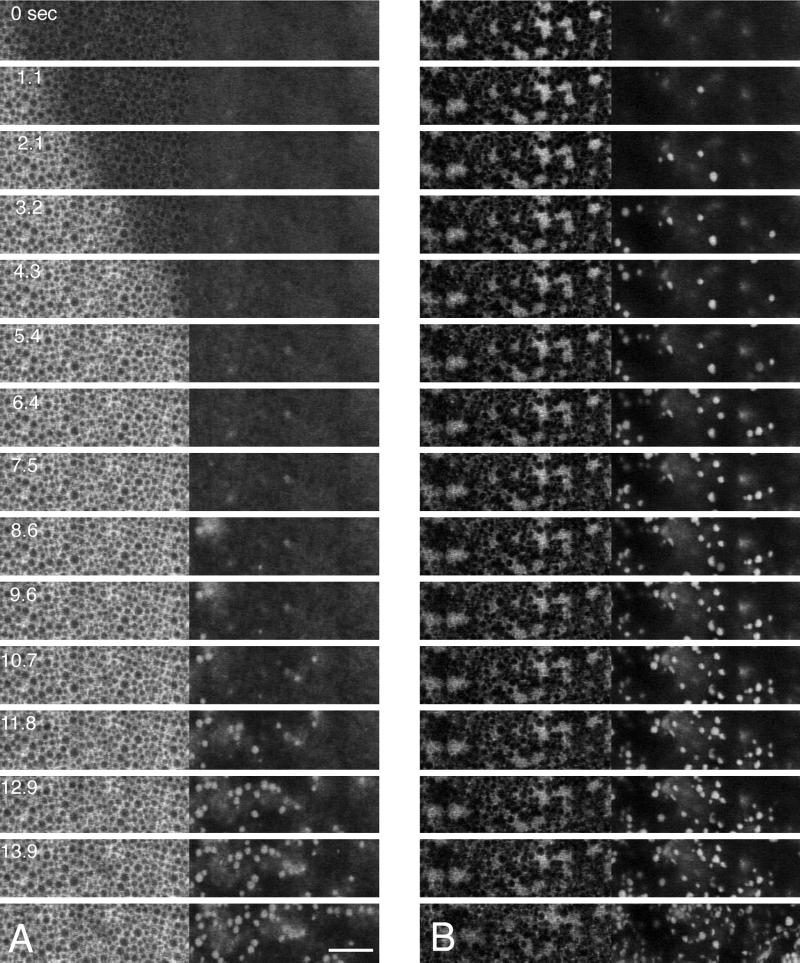
Figure 10.
Relationship of the ER change at activation to surface changes. (A) Double labeling with intracellular Ca green dextran (left panels) and extracellular 3-kDa rhodamine dextran (right panels). In sea urchin eggs, extracellular dextrans label exocytotic pits that result from fusion of the cortical granules (Terasaki, 1995); it appears that extracellular dextran labels frog eggs similarly. Time interval between frames is 1.07 s. The increase in Ca2+ precedes the first appearance of extracellular dextran-labeled spots by 5–7 s. (B) Double labeling with GFP–KDEL (left panels) and extracellular rhodamine dextran (right panels). Changes in the ER seem to start to occur after or at the same time as the first appearance of extracellular dextran-labeled spots. Because the Ca2+ rise precedes the extracellular dextran-labeled spots, this indicates that the changes in the ER begin to occur ∼5–7 s after the release of Ca2+. Bar, 10 μm.

