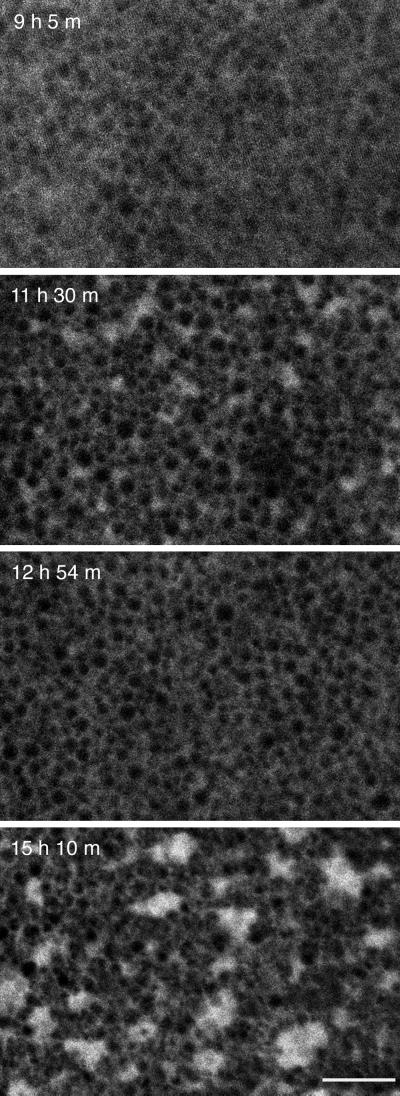
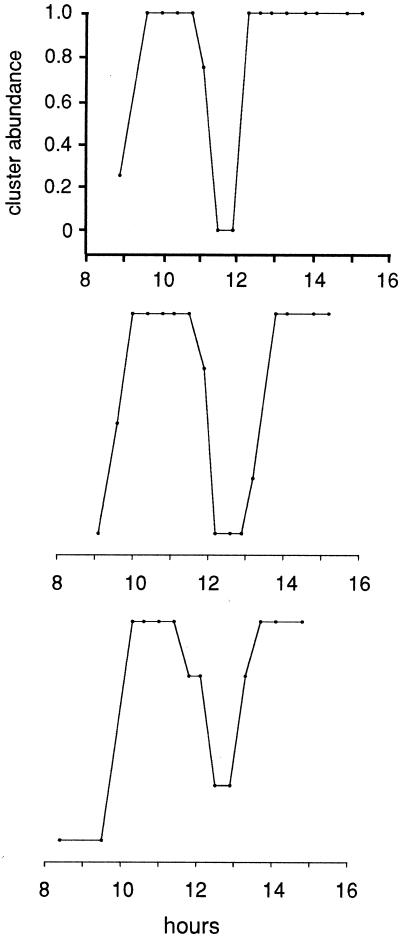
Figure 7.
Time course of the appearance of the GFP–KDEL-labeled clusters in the vegetal cortex during maturation. In this experiment, several oocytes were kept in individual dishes; at the various time points, individual oocytes were transferred to the microscope stage for imaging. The images shown were from the same oocyte. The time after addition of progesterone is indicated on the panels. The appearance of the white spot, caused by GVBD, was clearly seen in this oocyte first at 11 h. The image sequence shows the appearance of small clusters at around the time of GVBD, their disappearance at an intermediate time, and then the appearance of large clusters after the egg has become mature. Bar, 10 μm. Each graph shows the time course of the abundance of clusters for three different oocytes during maturation. Cluster abundance was scored visually on a scale between no clusters (0) and maximum number of clusters (1.0). The x-axis shows time after addition of progesterone. The graphs for the different oocytes were positioned so that the decrease in clusters is lined up. The middle panel corresponds to the image sequence.


