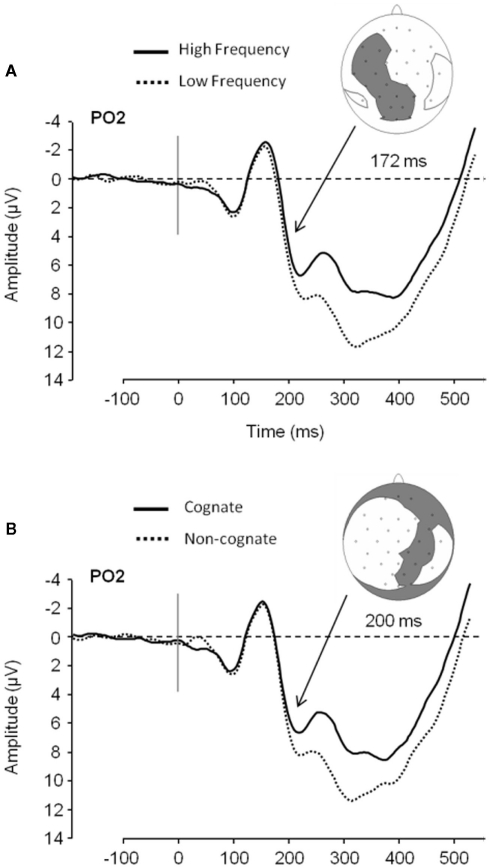
Figure 3.
ERP data plotted for word frequency and cognate status in overt object naming. (A) Low frequency ERPs compared to high frequency ERPs in Experiment 1 at PO2 and the electrodes showing a significant effect at 172 ms after picture presentation (gray area; it does not represent the topography of the effect). (B) Non-cognate ERPs compared to cognate ERPs in Experiment 1 at PO2 and distribution of electrodes showing a significant effect at 200 ms after picture presentation (gray area). (Figure taken from Experiment 1 in Strijkers et al., 2010).

