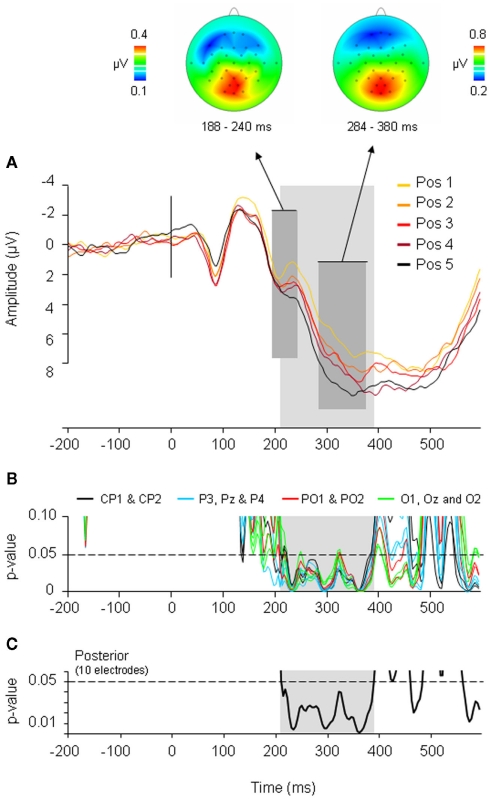
Figure 4.
Event-related potential (ERP) results and correlation analyses of the CSIE. (A) ERPs elicited by the five ordinal positions within the semantic categories. The waveforms depicted are the linear derivation of the 10 posterior electrodes where significant effects were present (CP1, CP2, P3, Pz, P4, PO1, PO2, O1, Oz, O2). The dark gray area refers to the P2 peak and P3 peak showing a linear and cumulative increase in amplitude with each ordinal position. Above the topographic maps of the averaged differences waves of the five ordinal positions for the P2 and P3 are shown. The light gray area refers to the time frame (208–388 ms) where ERP amplitudes correlated with ordinal position and RTs. (B) Significance graph of the correlation analyses at each sampling rate (4 ms) between RTs and ERP amplitudes at the 5 ordinal positions for the 10 posterior electrodes. (C) Significance graph of the correlation analyses at each sampling rate (4 ms) between RTs and ERP amplitudes at the 5 ordinal positions averaged over the 10 posterior electrodes. Correlations were reliably below the 0.05 significance level (following a row of 12 consecutive significant t-test; cf. Guthrie and Buchwald, 1991) between 208 and 388 ms after picture presentation (light gray area). (Figure taken from Costa et al., 2009).

