Figure 3.
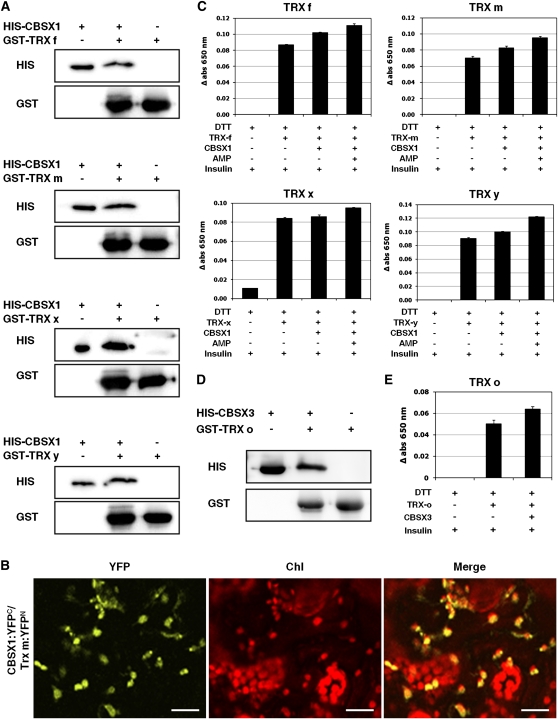
In Vitro Interaction of CBSX1 with Trxs and Modulation of Trx Activity by CBSX1 with or without AMP.
(A) Pull-down assay with chloroplast Trx f, m, x, and y proteins and CBSX1.
(B) Interactions of CBSX1 and Trx m in the chloroplast by the BiFC assay. Merge indicates an overlay of the YFP and chlorophyll autofluorescence image. Bars = 20 μm.
(C) Assay for the reducing activity of Trx f, m, x, and y using insulin protein and measured by absorbance at 650 nm. The error bars were calculated based on three independent experiments. The values are means ± sd (n = 3).
(D) Pull-down assay with mitochondrial Trx o protein and CBSX3.
(E) Assay for the reducing activity of Trx o using insulin protein and measured by absorbance at 650 nm. The error bars were calculated based on three independent experiments. The values are means ± sd (n = 3).

