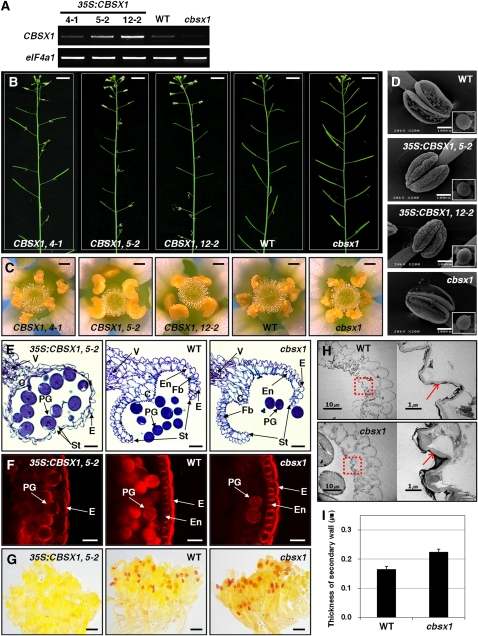
Figure 4.
Phenotypic Analysis of 35S:CBSX1 Overexpressors and cbsx1 Mutant Plants.
(A) Relative amount of CBSX1 transcript in wild-type (WT), 35S:CBSX1, and cbsx1 plants.
(B) Male-sterility phenotype of 35S:CBSX1 plants. Bars = 1 cm.
(C) Anther indehiscence phenotype of 35S:CBSX1plants. Bars = 0.2 mm.
(D) Scanning electron microscopy image of anthers and pollen grains from open flowers. Bars = 100 μm.
(E) Transverse section of wild-type, 35S:CBSX1, and cbsx1 mutant anthers. C, connective tissue; E, epidermis; En, endothecium; Fb, fibrous bands; PG, pollen grain; St, stomium; V, vascular region. Bars = 20 μm.
(F) Histochemical staining of lignin components. Anthers were stained with EtBr and visualized with a fluorescence microscope. Abbreviations as in (E). Bars = 20 μm.
(G) Phloroglucinol staining of lignin components in a bud cluster. Bars = 0.2 cm.
(H) TEM image of secondary cell walls of wild-type and cbsx1 anthers. Right: red-dotted squares magnified ×10. Red arrows indicate the secondary wall of the endothecium. Bars = 10 μm in left panels and 1 μm in right panels.
(I) Secondary cell wall thickness of wild-type and cbsx1 anthers. Error bars indicate the sd of the average of 10 independent measurements.

