Figure 5.
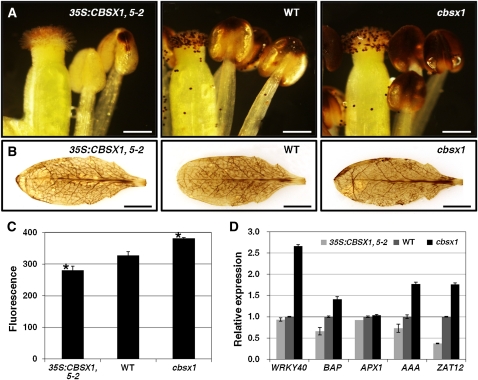
Detection of H2O2 and RT-PCR Analysis of ROS-Regulated Genes in 35S:CBSX1 Overexpressors, the Wild Type, and cbsx1 Mutant Plants.
(A) DAB staining of flowers. Bars = 0.5 mm. WT, wild type.
(B) DAB staining of rosette leaves. Bars = 0.5 cm.
(C) Measurement of endogenous H2O2. Data from three separate experiments are shown (mean ± sd; n = 5; statistical significances were determined using one-way analysis of variance followed by a Dunnett test). Asterisk indicates significant difference from the wild type at P < 0.001.
(D) Analysis of ROS-regulated gene expression in 35S:CBSX1, wild-type, and cbsx1 plants. The error bars were calculated based on three independent experiments. The values are means ± sd (n = 3).
[See online article for color version of this figure.]

