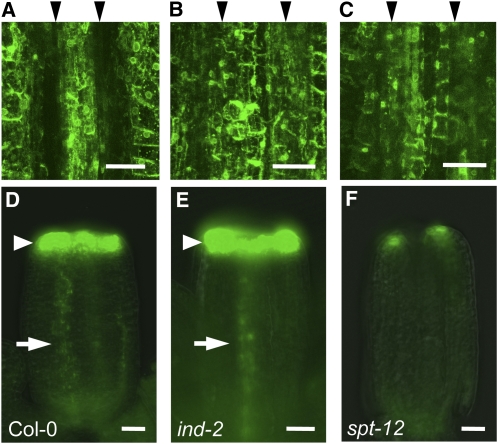
Figure 6.
IND and SPT Regulate Auxin Distribution.
(A) to (C) DR5:GFP expression in VM region of stage-17b fruits of Col-0 (A), ind-2 (B), and spt-12 (C). Black arrowheads above the images indicate the position of VM creases, which show a gap in fluorescence in the wild-type but not in the ind-2 and spt-12 fruits.
(D) to (F) DR5:GFP expression in stage-9 gynoecia of Col-0 (D), ind-2 (E), and spt-12 (F). Arrowheads and arrows indicate respectively GFP signals at the top of the gynoecium and in the presumptive replum.
Bars in (A) to (C) = 50 μm; bars in (D) to (F) = 25 μm.

