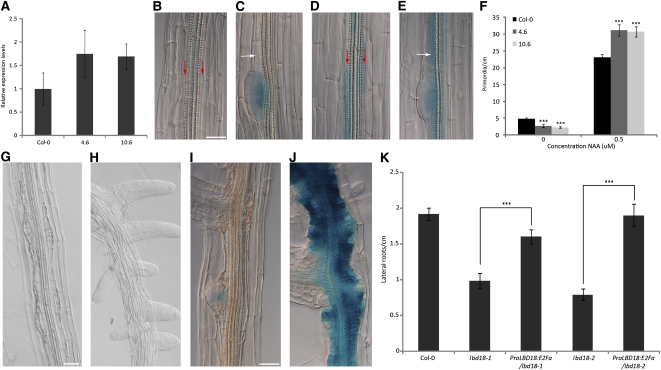
Figure 5.
LBD18 Overexpression Induces E2Fa Expression in Pericycle Cells and Hyperplasia upon Auxin Treatment.
(A) E2Fa expression levels in roots of control (Col-0) and Pro35S:LBD18-GFP lines 4.6 and 10.6. Data represent mean ± sd (n = 3).
(B) to (E) ProE2Fa:GUS expression in Col-0 ([B] and [C]) versus Pro35S:LBD18-GFP ([D] and [E]) plants. Red and white arrows mark enhanced GUS expression in pericycle cells and pericycle cells flanking lateral root primordia, respectively. Bar = 50 μm (all photomicrographs are at the same magnification).
(F) Lateral root density in 8-d-old seedlings that were transferred 4 d after germination to medium supplemented with DMSO or 0.5 μM NAA for an additional 4 d. Data represent mean ± se (n ≥ 12;***P ≤ 0.001; two-sided t test).
(G) and (H) Root phenotypes of control (Col-0) (G) and 35S:LBD18-GFP (H) after transfer for 4 d to medium supplemented with 1 μM NAA. Bar = 50 μm (all photomicrographs are at the same magnification).
(I) and (J) E2Fa expression in Col-0 (I) and Pro35S:LBD18-GFP (J) after transfer for 4 d to medium supplemented with 1 μM NAA. Bar = 50 μm (all photomicrographs are at the same magnification).
(K) Lateral root density in Col-0, lbd18-1, lbd18-2, and both lines complemented with the ProLBD18:E2Fa construct. Data represent mean ± se (n ≥ 12;*** P ≤ 0.001; two-sided t test).

